Apparency
A User Guide
Looking for something specific? The User Guide and FAQ are indexed within the app — open Apparency, click on the Help menu (Command-?), and type in the Search field. Results listed under Help Topics link directly to the appropriate User Guide section or FAQ entry here.
Opening an App in Apparency
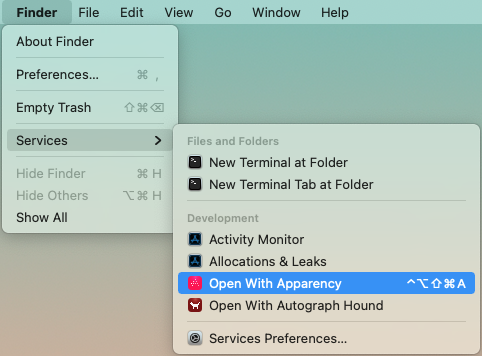
There are several ways to open an app using Apparency:
- In Apparency, choose File > Open, locate the app and click Open.
- In the Finder, locate the app and do one of the following:
- Drag the app icon onto the Apparency icon, either in your Dock or in your Applications folder.
- Select the app icon and choose Finder > Services > Open With Apparency (under the Development group).
- Control-click the app icon and choose Open With Apparency, near the bottom of the context menu. (This item might be grouped under Services, depending on how many services are applicable.)
- If the app is in your Dock, control-click on its icon there, and choose Options > Show In Finder. Then continue in the Finder as above.
If you don't see the Open With Apparency item in the Services menu or in the Finder context menu, choose Finder > Services > Services Settings, open to the Development item, and make sure that Open With Apparency is checked. You can also add a keyboard shortcut here, if you wish, but that's not necessary to make the menu item appear.
Whichever method you choose, Apparency opens a new window, showing the app itself, along with any components inside it:
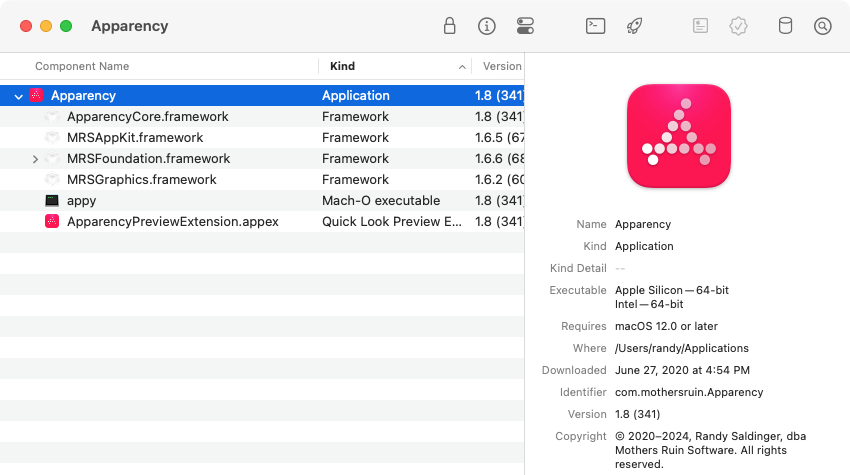
You can actually open any macOS bundle with Apparency, including an app plug-in or a standalone framework. You can also open a “bare” executable file, such as one found in /usr/local/bin. A bare executable can have many of the same attributes as a bundle, and can even have an embedded Info.plist.
Opening a Folder Containing Multiple Components
If you wanted to examine all of the apps (or other components) inside a folder, you could select multiple items in the File > Open dialog: this works, but opens each component in a separate window, which can get unruly. Also, maybe you'd like to search components across the entire folder, which requires having everything in one window.
To enable this sort of thing, Apparency allows you to open the folder itself. To do so, use File > Open as above, navigate to the folder you want to open, and click Open Folder. This can be a bit fiddly, since the standard macOS Open dialog isn't well-suited to selecting folders, but note that Apparency will change the button to Open Folder when a folder is selected (if the button says Open, a component is selected). Alternatively, you can drag the folder icon from the Finder onto the Apparency icon in your Dock.
Apparency will find all components inside the folder — whether directly inside, or within
some sub-folder — and will show these in the component browser. Apparency doesn't show the folder itself,
since it doesn't have any useful information; nor does it show any intervening sub-folders.
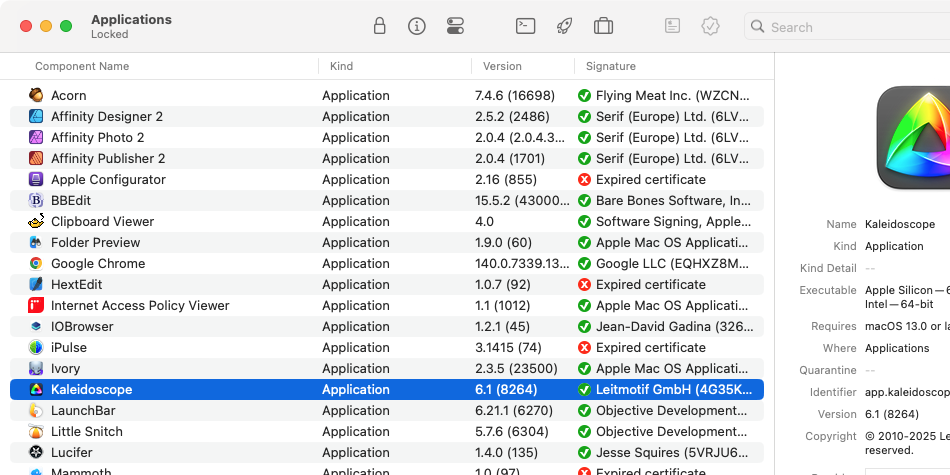
When you ask it to open a folder, Apparency will first ask if you're sure that's what you want to do. This is because opening a folder might take a long time — depending, of course, on the complexity and size of the folder you select. In our tests, a typical Applications folder actually opens fairly quickly (at least on modern Mac hardware); System > Library is not speedy, but not entirely unreasonable. Apparency won't allow you to open System directly (mostly because that would include /System/Volumes), nor the root of any data volume.
By default, when you open the standard Applications folder, Apparency shows only the apps that actually exist in the /Applications directory on the data volume. This differs from the Finder (and the File > Open dialog), which also shows the apps that are built into macOS, and which actually live in /System/Applications on the system volume. However, if you'd prefer a merged view, like the Finder, scroll to the bottom of the component browser and click Include System Apps. (If you want Apparency to always do this automatically, go to Apparency > Preferences > General and check Automatically include system apps in standard folders.)
By default, when you open a folder in Apparency, it finds the top-level components (e.g. apps) inside the folder, but does not look inside those for sub-components. This is intended to make opening a folder faster, especially since you might not be particularly interested in the sub-component detail for every app. If you later decide you want to see those sub-components, you can ask Apparency to load them by scrolling to the bottom of the component browser and clicking Look Inside Components. Or, if you know you want the sub-components right off, before clicking Open, click Show Options if necessary, and then check Look inside this component for sub-components.
Opening a System Component by Name
If you want to examine a system component — that is, a component that is part of macOS itself — Apparency can make it easier to find and open the right one.
Choose File > Open System Component (Cmd-Control-O), and start typing the name of the
component — or some portion thereof. Apparency will show the system components that match this name:
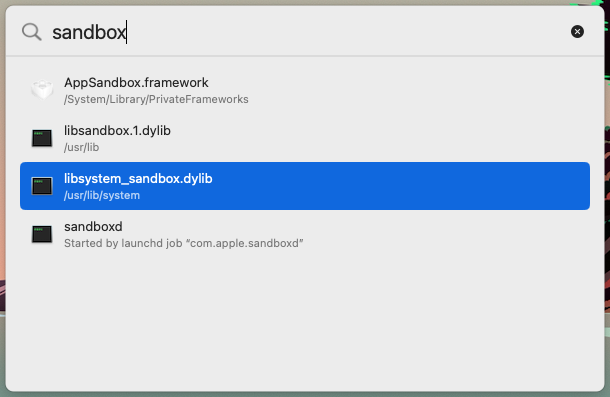
When you select an item in this list, Apparency will open that component. Or you can continue to refine your search text, until the component you want appears in the list.
You can use this mechanism to find and open the following types of system components:
- macOS frameworks, whether in /System/Library/Frameworks or /System/Library/PrivateFrameworks. Apparency will find frameworks whose base name (ignoring the path and .framework extension) contain the entered text. Of course, you could also open these using File > Open, but it takes some navigation to get to the right place.
- macOS dylibs, which might live in /usr/lib, but in almost all cases will have been moved into the DYLD shared cache, which makes using File > Open a non-starter! Apparency will find libraries whose base name (ignoring the path and .dylib extension) contain the entered text. You can include the standard lib prefix or not.
- macOS executables that are started automatically by launchd jobs. Apparency will find the launchd jobs whose label or service names contain the entered text, and will show the executables that are referenced by those jobs. This is handy way to find the executable that provides a named service, without having to hunt down the launchd plist and examine the program path therein.
- macOS apps, executables and bundles that live in standard system directories, such as /usr/bin, /usr/libexec or /System/Library/CoreServices. Apparency will find components in these directories, where the base name (ignoring the path and any extension) contains the entered text. This can be more convenient than navigating to the executable via File > Open, especially for the traditional Unix paths that aren't visible by default.
Of course, there are other types of system components in other places, so this mechanism won't work for everything.
You can change where Apparency looks for system components by going to Apparency > Preferences > Locations > Open System Component looks in. You can also go there to see (or change) the standard system directories that Apparency will search.
Opening a System Library with a String Literal
The Open System Component mechanism can be helpful if you know the
name of the component you want. But sometimes all you have is a string — such as from an alert dialog, a
message in the Console log, or perhaps a key found via a defaults(1) command. How can you find
the responsible macOS system framework or library?
Choose File > Open System Library with String Literal (Shift-Cmd-Control-O).
Type (or paste) the string you have, and Apparency will show the system libraries that reference this string:
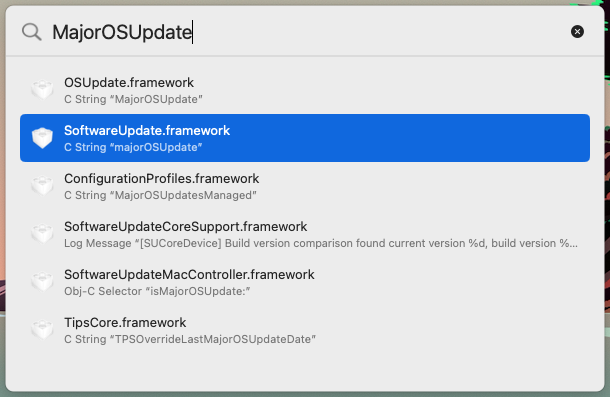
This mechanism searches for the given string in several sections of the __TEXT segment
which are marked as containing C string literals — including __cstring (C string literals,
and higher-level string types built upon them), __oslogstring (literal format strings sent to the Unified Logging system),
__objc_classname (the names of Objective-C classes), and __objc_methname (the names of
Objective-C selectors and properties).
You can change which__TEXTsections Apparency will search by going to Apparency > Preferences > Locations > Look for string literals in sections. You can add sections to this list, but note that only sections in the__TEXTsegment will be searched, and then only if those sections have theS_CSTRING_LITERALStype. Apparency doesn't know how to do the aggressive heuristic-based searching that would be done bystrings(1).
This mechanism also searches for the given string in the list of dynamically linked libraries for each system library —
that is, it finds the system frameworks or dylibs that use another library matching the given string.
(In Mach-O terms, these are the strings from the LC_LOAD_DYLIB commands.)
This can be helpful to find where some code of interest is getting invoked. But if you'd rather not see these,
go to Apparency > Preferences > Locations > Open with String Literal looks in
and uncheck Names of libraries and frameworks linked by component.
For each match, Apparency will show the actual string that it found in that system library (or the first such string, if a single library contains multiple matches). Select a match to open that system library in Apparency, after which you can get more information using Component > Show String Literals from Executable, as described here.
Alternatively, you might want to proceed directly to some sort of disassembly of the library, such as analyzing it using the Hopper Disassembler.
By default, this mechanism searches only those system frameworks and dylibs that have been moved into the DYLD shared cache. This is usually fast, and often all that you need. However, if you want to do a more exhaustive search of system components — including types such as executables, app extensions and XPC services — you can go to Apparency > Preferences > Locations > Open with String Literal looks in and choose All system components. Apparency will then search for the given string across all of the Mach-O binaries it can find under System > Library (and a few other related locations), in addition to searching the DYLD shared cache. You should expect to wait a bit longer to get results, however, particularly for the first search term (after launching Apparency, or after selecting this preference).
Opening a Component from the Terminal using the “appy” Command-Line Tool
If you're working in the Terminal, you might already know the path of the component you want to examine, and would like to open it directly. You can do this with Apparency's command-line tool, called appy.
The appy tool is delivered inside the Apparency application bundle, but consistent with our philosophy that you should decide when and how to install software on your Mac, the app does not try to install the command line tool for you. Choose Help > About the Command-Line Tool for instructions on adding the appy tool to your path.
The appy command line is straightforward: just give it the (possibly relative) path to the component that you want to open in Apparency:
appy Utilities/Grapher.app
Of course, there are other ways to open a file in a specific app, such as with open(1),
but this is a bit more succinct.
The appy tool allows you to tell Apparency to immediately search any de facto code places for additional sub-components:
appy --defacto Xcode.app
The appy tool also allows you to open system dylibs that have been moved into the DYLD shared cache, and as such, don't even exist on disk. So you can do something like:
appy /usr/lib/libxar.1.dyliband Apparency will open the library, in spite of there being no actual file at that path!
When opening a cached dylib like this, you must provide the canonical path, which is the one known to the DYLD shared cache. This is often a name with some sort of version number embedded, while the “generic” name was a symbolic link. In the example above, we have to use libxar.1.dylib instead of libxar.dylib, because the latter is only a symbolic link (and not even one that still exists). If you don't know the proper canonical path, try using the Open System Component command to search for the library.
The appy tool can also be used to open a folder of components:
appy --folder /Applications
Adding the ‑‑folder option serves to circumvent the usual confirmation dialog.
Examining the App Structure
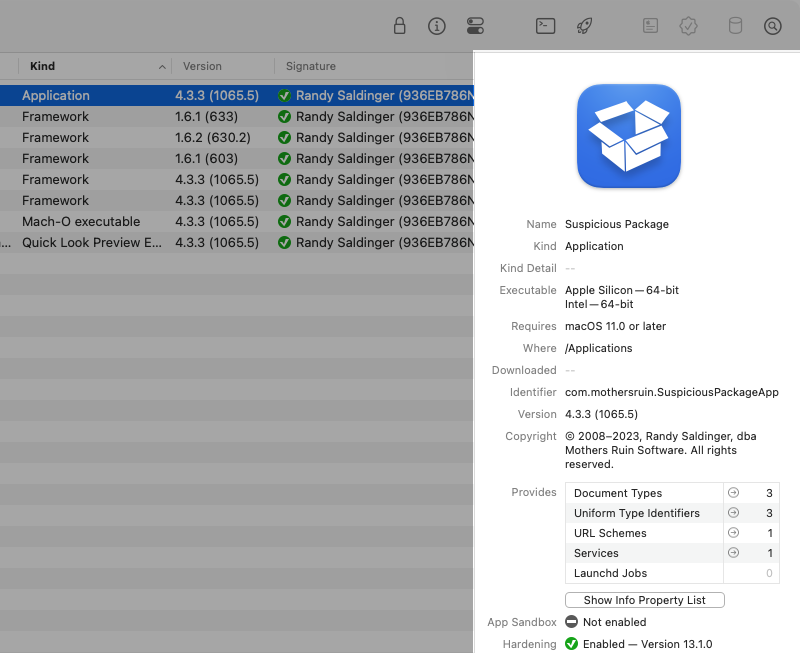
The browser, on the left side of the main Apparency window, shows the basic structure of the app:

At the top of this view is the app itself. Most apps also contain other components inside them — frameworks, plug-ins, app extensions, Spotlight importers and so on. These components are shown underneath the main app, using a hierarchical view similar to the Finder's List view. If any of the components contain sub-components, use the disclosure button to expand these further.
Apparency's component browser doesn't show all of the individual files inside the app bundle. Rather, Apparency shows bundles — and bare executables — that are found in specific places within the app, as defined by macOS. For example, macOS requires app extensions to be placed in Contents/PlugIns, so Apparency will look there. The point is to show components that add to system functionality (as is the case with app extensions, for example), as well as those that are simply part of the app's internal organization (such as frameworks).For navigating the individual files, you can always use the Finder: that is, Control-click the app icon and choose Show Package Contents. Alternatively, Apparency provides a Bundle Resources inspector, which shows the individual files that are protected by that component's code signature. This is especially useful for components flagged as Bundle resources modified, but it can be used on any bundle-based component. See below for more information.
By default, Apparency looks for components only in well-defined places, as defined by macOS, rather than examining every file and folder inside the app (which could become quite slow for large apps). However, this may miss some components, which sometimes live in other places, such as the Resources folder. If you want Apparency to try harder to find components, click the Look in De Facto “Code Places” button at the bottom of the component browser. Or, if you prefer a keyboard shortcut, see File > Look for Components in De Facto “Code Places” (Option-Command-L).
The columns of the browser show some basic information about the app, and any components:
- The Kind column shows the type of component, akin to what the Finder would show for this bundle (although for certain types, such as app extensions, Apparency tries to provide a more detailed kind).
- The Version columns shows the full version information, such as you'd see in a standard app About window.
- The Signature column gives a summary of the code signature information for the component, which is discussed at much length below.
Click on the Name, Kind or Version column title to re-order the components accordingly. This can be useful for an app with a large number of components.
If you've opened a folder, you might also want to sort by the Signature column, since the contents of the folder are likely to have different Signed By identities or other status information. If one or more components are still in Verifying signature status, the component browser will re-order itself as verifications complete.
Getting Information About a Component
The info pane, on the right side of the main Apparency window, shows information about the app or
other component that is currently selected in the browser:
General Information
In the top part of the info pane, Apparency shows general information about the app or component:
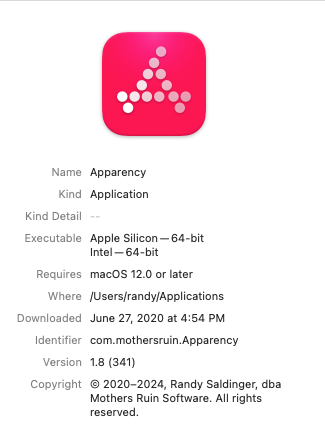
- Name is that reported by macOS and shown by Finder.
This is almost always the actual name of the file on disk
(perhaps hiding an extension like app). But if there's an info button
 after the name, this is a localized display name that differs
from the file name: click the button for details.
 - Kind is akin to the Kind shown by the Finder. You can click on this text to show the underlying Uniform Type Identifier (UTI) that macOS defines for this kind (e.g. “com.apple.application-bundle”).
- Kind Detail is shown only for certain kinds of component. For example, for an “Application and System Extension,” Apparency shows the specific type of extension, such as “Photo Editing Extension” or “Share Extension.” You can click on this text to show the underlying identifier (e.g. “com.apple.share-services”).
- Executable shows the supported processor architecture, such as Intel — 64-bit
or Apple Silicon — 64-bit. If the app is “universal,” multiple
architectures are shown. You can click on this text to show the underlying symbolic name used by macOS,
such as
x86_64orarm64. You can also get more information about the executable as described below. Note that some components don't have an executable, or (less often) have an interpreted script as their executable, so you may see no value or a specific file kind here. - Requires shows the oldest version of macOS supported by the component (for any processor architecture), if the component declares this. This information is most meaningful on the top-level app (even though it might still be declared on lower-level components). See more info here.
- Where shows the location of the component. Except for the app itself, the location is given relative to the app or other immediate containing component. If you want to go to that location, you can choose Component > Show Component In Finder (Cmd-Shift-R).
- Quarantine shows when the app was either downloaded by a web browswer or opened by a sandboxed app. You can click on this text to see which app triggered the quarantine and how — such as “Downloaded by Safari” or “Opened by Hex Editor”. If the quarantine text is grayed out, Gatekeeper has already been told to proceed with opening the app, and it is no longer quarantined (but Apparency still shows the date for reference). Some apps are never quarantined in the first place, such as those installed via the Mac App Store or macOS Installer packages. For more background on quarantine — and a discussion of why Apparency would sometimes apply its own — see this FAQ.
- Identifier shows the bundle identifier of the component. This is the name by which macOS knows the app or component, and you'll sometimes see these identifiers used elsewhere, such as in the name of preferences files or in Console logs.
- Version shows the full version information, such as you'd see in a standard app About window: the first number is the “short version” and the one in parentheses is the “bundle version,” which are both significant parts of Apple's standard versioning scheme.
- Copyright shows the copyright information associated with the bundle. If this ends with an ellipsis (…) character, Apparency truncated long copyright text, but you can hold the pointer over it to show the full text.
Most of these attributes can be selected, and thus copied. Unfortunately, this can make the cycling attributes, such as Kind, a bit squirrelly to work with. If you single-click, Apparency will still cycle through the different values. If you double- or triple-click, Apparency will instead enter selection mode, with the appropriate select-word or select-all behavior. If you want to get out of selection mode, so that the attribute values cycle again, press the Escape key. Or click on the label for the attribute, instead of the attribute value: this will always cycle the attribute, regardless of selection state.
Document Types and Services Provided
In the middle part of the info pane, Apparency shows a summary of the definitions and services that the app provides to macOS:
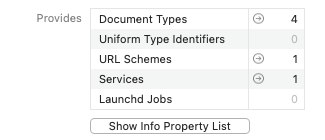
- Document Types tell macOS what kind of files the app can open, such as through the File > Open dialog, or via drag-and-drop. These can include standard types (like text or JPEG files) and/or app-specific types (like a Keynote presentation).
- Uniform Type Identifiers (or UTIs) define new types of files that are not standard to macOS. These typically work together with the Document Types, but are not necessarily the same lists — an app doesn't need to re-define standard types, but it may define types for files that are not documents per se (such as a plug-in or the like).
- URL Schemes tell macOS what kind of URLs the app can handle. Sometimes, these
are common URL schemes; for example, an FTP client might declare that it handles
ftp:URLs, while Apple Mail handlesmailto:URLs. More often, these are new schemes that are custom to the app, and begin with anx-prefix by convention. Custom schemes are typically used for lightweight inter-app linking, such a URL in a purchase receipt e-mail, which when clicked, opens the app and pre-populates the registration dialog. - Services define new items that the app would like to add to the Services menu in the Finder and/or other apps. Services act on a selected item — such as a file, some text or an image — and do [something] with it, depending on the app. In fact, this is how Apparency adds the Open With Apparency item to the Finder: in this case, the [something] that Apparency does is simply to the open the selected app. Note that services provided by apps can be enabled or disabled, so that you don't wind up with a Services menu cluttered with garbage you never use: open System Settings and go to Keyboard > Keyboard Shortcuts > Services.
- Launchd Jobs configure macOS to launch the component as a daemon (which runs as the root user) or an agent (which runs as the current user). These are usually background services that have no visible UI, and that provide functionality even when the app isn't running. In macOS 13 (Ventura) or later, these are called “background items” and are nominally managed via System Settings, under General > Login Items & Extensions > App Background Activity (prior to macOS 26, look for Allow in the Background).
For each of these, Apparency simply shows how many of each type is found (because it is difficult to summarize
the contents in any succinct way). To see more information, click the

Code Signature, Sandbox and Gatekeeper Info
In the lower part of the info pane, Apparency shows the status of the code signature and other security features:
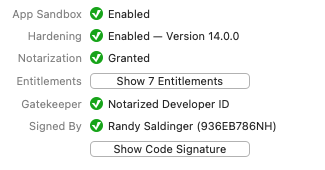
- App Sandbox shows if the app is sandboxed, which is Apple's scheme for limiting the capabilities of an app (something like the restrictions on all apps in iOS). Apps distributed through the Mac App Store are required to use the App Sandbox, but other apps may also do so.
- Hardening shows if additional runtime protections have been enabled. This feature was introduced in macOS 10.14 (Mojave), and is intended to limit the damage that a compromised app can do, by turning off capabilities that it doesn't normally require. Hardening generally covers a different set of capabilities than — and is less restrictive than — the App Sandbox, so an app might use both.
- Notarization shows if the app was submitted to
Apple's notarization service,
which checks for certain security features (such as hardening) and does some sort of malware scan. If these
automated checks pass, Apple grants a notarized status to the app.
A description of each possible notarization status is available here
— or move the pointer over the status and click the help
 button that appears.
 - Entitlements are assigned to the app when it is signed by the developer. An entitlement is an Apple-defined property that grants some capability to the app, as described below. Click the Show Entitlements button to show these properties.
- Gatekeeper shows how the Gatekeeper
feature of macOS would handle the app when you open it after download, at least by default. Gatekeeper
checks the code signature and notarization status, among other things, to determine an applicable “policy.”
A description of each possible Gatekeeper status is available here
— or move the pointer over the status and click the help
 button that appears. To see the actual Gatekeeper policy rule that matched the app, use the
Launch Information inspector.
 - Signed By shows the name of the certificate that was used to sign the app. Typically,
this is either an Apple certificate — for apps that come with macOS, or that are downloaded from
the Mac App Store — or an Apple-issued Developer ID certificate, in which case the name of the
developer is shown.
Descriptions of possible Signed By identities are available here
— or move the pointer over the identity and click the help
 button that appears.
Note that you can select more than one component in the browser. When you do this, the info pane will show the information that is identical for all of the selected components. This is a quick way to determine if multiple components support the same processor architectures, or have the same code-signing identity, for example. Any attributes that have different values for one or more of the selected components will show Multiple values instead.
Getting Details About a Component
While the info pane gives you a summary of the selected app or component, there are buttons in the toolbar that allow you to see more details. (Some of these are also available through buttons in the info pane itself; use whichever one is more convenient.)
Show the Code Signature
If the selected app or component was signed, click the Signature toolbar button

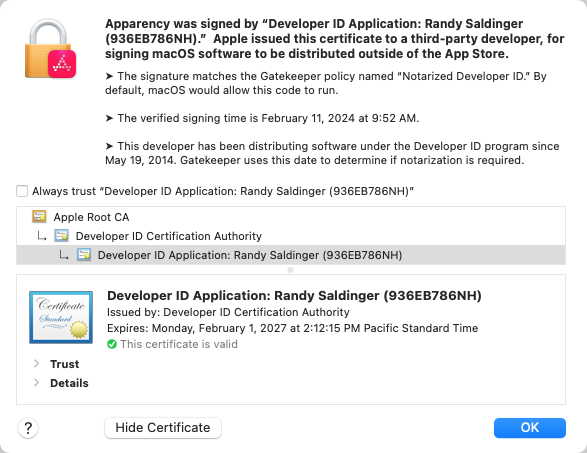
Click the Show Certificate button to examine the certificate that created the signature, and the entire chain up to the Certificate Authority, which is typically the Apple Root CA. Select an individual certificate in the chain, and click the disclosure arrow next to Details to see more information.
You can also export a certificate by dragging the certificate icon (from the lower pane) and dropping it in the Finder. This will give you a DER-format file that you can open with Certificate Assistant, or manipulate with command-line tools likesecurity(1)oropenssl(1).
Show the Info Property List
The information property list — or simply, the Info.plist — contains a number of Apple-defined properties. These tell macOS how the app or component works, what it can do, what icon to show, what documents it can handle, and many other things. Apparency extracts a few interesting bits of the Info.plist to show in its info pane — such as the version information, the bundle identifier, and so on — but you may still want to examine the Info.plist in its entirety.
Click the Property List toolbar button

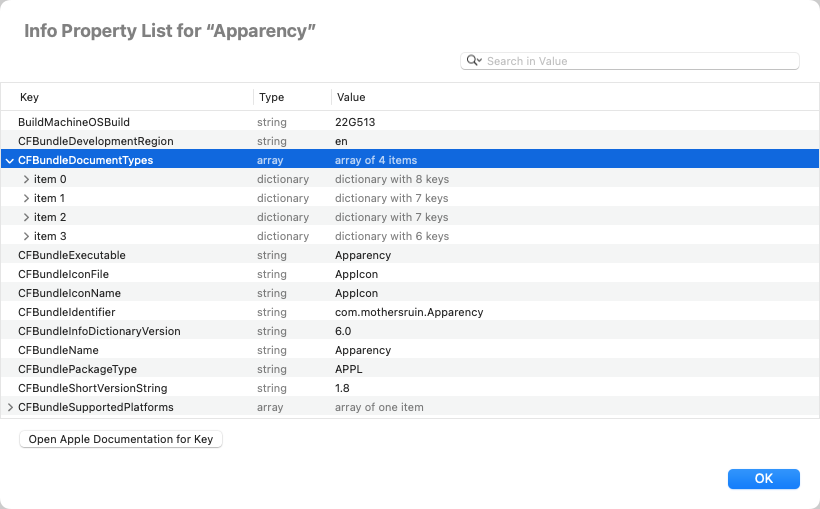
Most of the Info.plist keys have some sort of documentation on Apple's Developer site: to jump directly to
that documentation, select a row and click Open Apple Documentation for Key. (If this button
is disabled, Apparency doesn't have a direct link for that key, either because the key isn't documented or because
we didn't find the documentation to index it.) Alternatively, when you move the pointer over a key name, if a link button

If you're looking for a particular key or value, click in the search field (or use Cmd-F) and type the text
you want to find. Apparency will show only the rows that match, or for arrays or dictionaries, the rows that contain matches.
Click the search options button


Show the Entitlements
The entitlements of an app or component enumerate specific capabilities that the component requires to do its work. macOS grants (or denies) these capabilities to the app or component, based on the entitlements and (sometimes) other restrictions. Entitlements take several forms:
- If the App Sandbox is enabled, macOS denies many capabilities by default (for example, the ability
to read or write user files, or to make or receive network connections). The required capabilities
are then granted by macOS if the appropriate entitlement is present; for example, setting
com.apple.security.network.clienttoYESallows outgoing network connections. (This ability is limited to the entitlements that are defined by Apple, and for apps distributed through the Mac App Store, they are subject to rejection by App Review.) - If Hardening is enabled, the scheme is similar: macOS defaults to denying a number of less commonly
needed capabilities — especially ones that Apple deems subject to exploitation if the app is compromised.
If the app actually requires any of those capabilities to function properly, the appropriate entitlements will
cause macOS to grant them. For example, setting
com.apple.security.personal-information.locationtoYESallows the app to request location information. - Outside of App Sandbox or Hardening, many macOS capabilities and Apple services are available only to apps or components having the appropriate entitlements. For example, the ability to receive push notifications, or the ability to use iCloud services, are controlled by entitlements. (Again, these may be subject to App Review if the app is distributed through the Mac App Store. Outside of the App Store, they may require a provisioning profile as discussed below.)
- A few entitlements relate to the sharing of data between different apps from the same
developer. For example,
com.apple.security.application-groupsestablishes shared folders which multiple apps can use to store or exchange data (as described below). - Finally, there are a vast number of private-to-Apple entitlements, which control access to macOS
services that Apple deems as off-limits to third party apps entirely. The ability to
access Internet Accounts information, or to talk to the App Store, are two examples, but there are
many, and they are undocumented, for obvious reasons. Typically, these entitlements start with a
com.apple.privateprefix (but some that don't are probably still considered private). Note that macOS typically refuses to grant capabilities for private entitlements unless the app or component was signed by Apple itself.
Click the Entitlements toolbar button

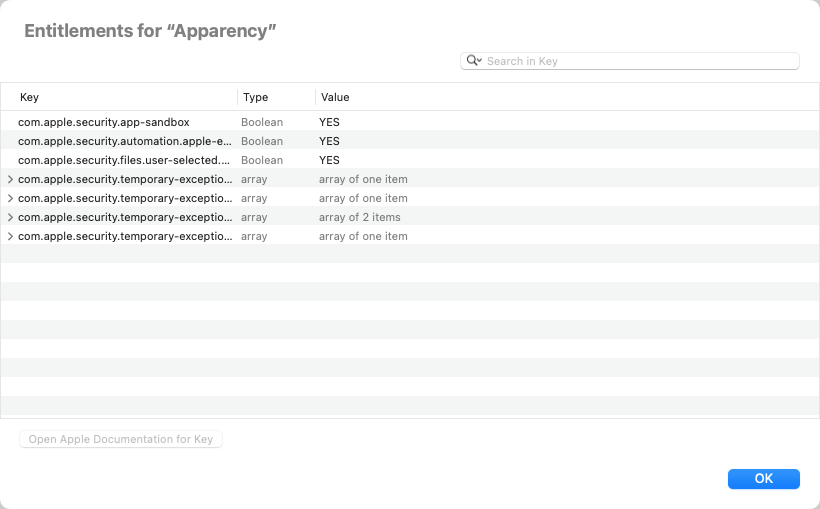
As described above for the Info.plist, documentation links to Apple's Developer site are available for some entitlement keys.
Likewise, you can use the search field to filter entitlements on specific key or value text.
If the selected app has a provisioning profile, as discussed below, there will be an additionalcolumn that shows whether each entitlement is allowed by the profile. See here for a description of each possible entitlement provisioning status.
Apparency can also show a “merged” view of all entitlements requested by all of the components of an app. This can be helpful to get an overall sense of what the app will do, especially when creating a Privacy Preferences Policy Control (PPPC) Profile. Use File > Show Entitlements for All Executables (Cmd-Control-A) to view the merged entitlements: these are explained further in the FAQ.
Show Executable Information
Apparency can show details about the executable file associated with an app or component.
Click the Executable toolbar button

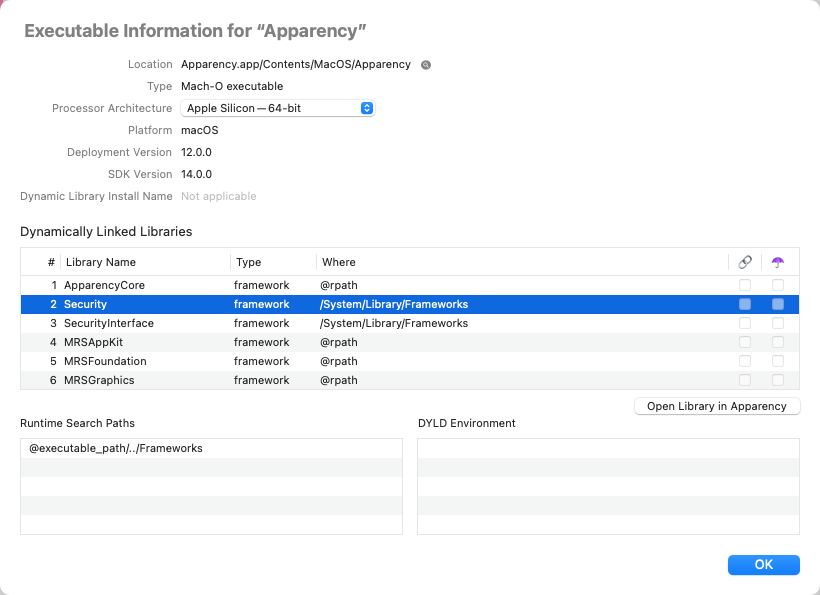
The information shown for an executable is mostly of the sort you would otherwise need the
otool(1) or objdump(1) tools to access:
- The Location shows the path to the executable file, relative to the component itself.
Click the adjacent Show in Finder

- The Type shows the Mach-O binary type of the executable, which generally follows from the kind of component — a dynamic library for a framework, a bundle for a plug-in, an executable for an app extension, and so on.
- The Processor Architecture pop-up shows which architectures are supported by the executable.
Most executables today support both the Intel — 64-bit and
Apple Silicon — 64-bit architectures. Choosing a different architecture
from the pop-up will update the rest of the executable information, although you might not notice any change if the
displayed information is all identical. Hold down the Option key to show symbolic architecture names (such as
x86_64orarm64) in the pop-up menu. (If there is only one supported architecture, the pop-up button will be disabled, since there's no other choice.) - The UUID is a unique identifier for the executable, which is assigned by the macOS linker
(on a per-architecture basis). You might, for example, see this referenced in a crash report. (Note that, although
this UUID will change when the code and/or build environment change, it is actually stable when building the same
code using the same tools on the same OS version. As the
ld(1)man page says, “by default the linker generates the UUID of the output file based on a hash of the output file's content.”) - The Platform is almost always macOS, but you may occasionally see something different, such as UIKit for Mac (“Catalyst”).
- The Deployment Version shows the earliest supported version of macOS that was specified by the developer when building the executable. This information is generally also encoded in the Info.plist of the component, but not all components have an Info.plist, and this is a more direct record of the configuration specified when the executable was linked. (The deployment version can differ for Catalyst apps, where it tends to track an iOS version rather than a macOS version.)
- Likewise, the SDK Version shows the newest version of macOS from which the executable uses system APIs. That doesn't mean it won't run on newer versions of macOS, just that it doesn't use any APIs that were introduced on newer versions. In practice, this pretty much corresponds to the version of Xcode that was used to build the executable, since Apple no longer provide multiple SDK versions within a single version of Xcode. (Again, this version can differ for Catalyst apps.)
- The Dynamic Library Install Name (applicable only to the Mach-O dynamic library type)
shows the internal install path for this library. This is saved at app build time, so that the library can be
found again when the app is eventually run. For most dynamic libraries packaged inside of an app, this will start with a
special
@rpath,@loader_pathor@executable_pathvariable, which locates the library relative to the component that is using it, no matter where the app itself is installed. See thedyld(1)man page for more information about these special variables. - Dynamically Linked Libraries shows all of the dynamic libraries that are used (directly) by this
executable. This is typically a mixture of macOS system libraries and (perhaps) frameworks or dynamic libraries
bundled with the app. The Where column shows where each library is expected to be found; this comes
from the library's Dynamic Library Install Name (see above), and might use a special dyld variable like
@rpath. The libraries are initially sorted by the specified link order, but you can click the column headings to re-order them; sorting on the Where column is a handy way to group system libraries and bundled ones. The last two columns show if any of the libraries are weakly-linked (🔗) or are being re-exported as part of an umbrella framework (☂️).If you want to open any of these dynamic libraries in Apparency, you can do so by selecting the library and choosing Open Library in Apparency — or just double-click on the library. This works for any library that is referenced by an absolute path, such as /System/Library/Frameworks or /usr/lib, even if the dylib has been moved into the DYLD shared cache. However, Apparency doesn't know how to resolve
@rpathor other dyld variables; such libraries are probably already shown in the current window's component browser, though. - Runtime Search Paths shows any locations that will be searched to find Dynamically Linked Libraries
which have a Where starting with
@rpath. In other words, these are the paths that are substituted for@rpathby the linker at runtime, in order to find the library. If these are used, they will generally be relative to one of the other special variables,@loader_pathor@executable_path. Again, see thedyld(1)man page for more information. - DYLD Environment shows any equivalent environment variables that the dynamic linker should assume
are set when loading this executable or library. This is unusual, but can be used to influence which
Dynamically Linked Libraries are found; for example, Safari sets
DYLD_VERSIONED_FRAMEWORK_PATHto find a possibly newer version of WebKit than is used by other apps on the system. Thedyld(1)man page documents these environment variables.
Show Launch Information
macOS has various features that control how and when a specific app or component might be launched. For
example, Gatekeeper decides if the component can launch;
launchd(8) often does the actual launching, based on some trigger or other event; and
launch constraints restrict what is allowed to perform or trigger the launch.
Apparency gathers this launch-related information into a single inspector. Select a component and
click the Launch toolbar button

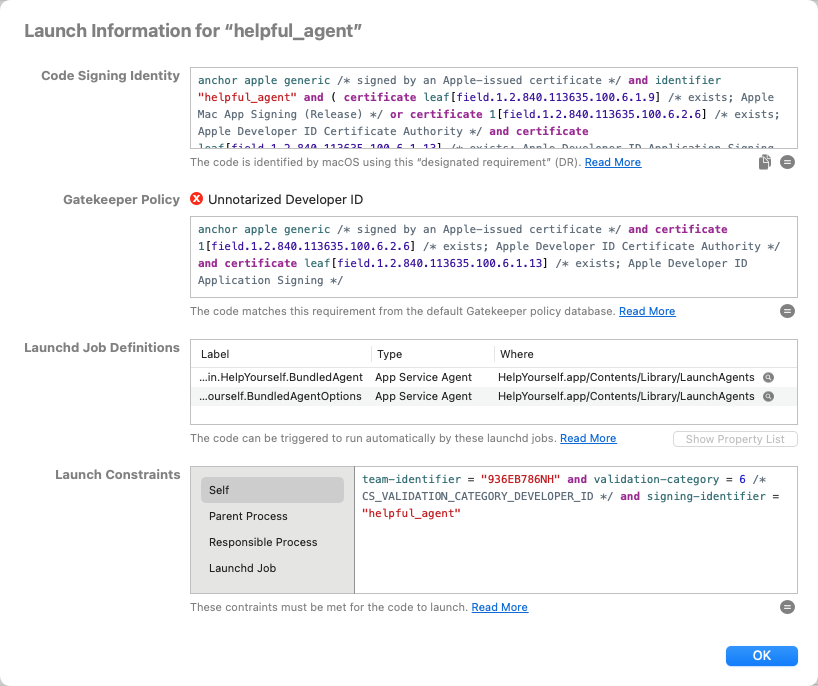
In this inspector, you'll find the following launch-related information:
- The Code Signing Identity is used by macOS to grant access to sensitive resources —
such as keychain items or App Sandbox “containers” — in a way that won't break every time the app is updated.
This Boolean expression is a code signing requirement, as explained here.
Apparency adds syntax highlighting and comments to improve the readability of the code signing requirement, so it won't look identical to the one produced by macOS, e.g. using
codesign(1)with‑‑requirements. If you want that canonical version of the code signing identity, click the copy button
To understand how the code signing requirement works, you can ask Apparency to evaluate it. Click the evaluate button

Apparency re-implements the evaluation of the code signing requirement, in order to show these sub-expression results. We believe it works the same as the standard macOS code signing requirement evaluation, but there may be edge cases; if in doubt, try using
csreq(1)or the‑‑test‑requirementoption oncodesign(1). - The Gatekeeper Policy shows how the Gatekeeper status
was determined. As explained here, Gatekeeper policy rules are also code signing
requirements, and Apparency shows both the name of the matched policy and the underlying requirement expression.
If the policy is simply Rejected, no rules were matched and the
expression will be blank. Also note that the policy might be a deny rule, such as
Unnotarized Developer ID,
so merely matching a Gatekeeper policy doesn't mean that the code is allowed to run.
As with the code signing identity (above), Apparency adds syntax highlighting and comments to make this expression more readable. Here too, you can click the evaluate button

- If the component executable can be launched automatically by one or more Launchd Jobs,
these are shown here. To identify the launchd jobs associated with the component, Apparency reads the
launchd job definition plists from various standard locations (as explained here),
and shows the ones that reference this executable.
Apparency shows the Type of each launchd job as one of the following:
- A Launch Daemon is defined in /System/Library/LaunchDaemons for macOS services, or in /Library/LaunchDaemons for third-party services.
- A Launch Agent is defined in /System/Library/LaunchAgents for macOS services, or in /Library/LaunchAgents — or in the Library/LaunchAgents subfolder of your home folder — for third-party services.
- An App Service Daemon is installed using the
SMAppServiceAPI, from a job definition plist found inside the app bundle at Contents/Library/LaunchDaemons. - An App Service Agent is installed using the
SMAppServiceAPI, from a job definition plist found inside the app bundle at Contents/Library/LaunchAgents. - A Privileged Helper is a daemon that is installed using the
SMJobBless()API, using a launchd plist that is embedded in the daemon executable, which itself is found inside the app bundle at Contents/Library/LaunchServices.
For each job, Apparency shows where it found the job definition plist; click the reveal button

To view the actual property list, select a job definition and click Show Property List, or just double-click the job.
- Lastly, any Launch Constraints are shown. As explained here,
a launch constraint is either explicit (for a third-party component) or implicit (for a component that is
part of macOS itself), and will also have a type that determines which process the constraint is checked against.
To view an individual launch constraint, select one of the listed types. Implicit constraints will have their constraint category value shown after the type. If you move the pointer over a type, a tooltip will show more information about where the constraint originated.
When you select a type, Apparency shows the corresponding constraint as a Boolean expression — using a bespoke syntax that is heavily patterned after the code signing requirement language — with syntax highlighting and some (hopefully) helpful comments.
This Boolean expression syntax is our attempt to make the launch constraint easier to read and more succinct than Apple's property list format. macOS does not create nor understand this format for launch constraints.
Like a code signing requirement, you can ask Apparency to evaluate a constraint. Click the evaluate button

Depending on the constraint type, you may need to specify the executable to evaluate against by clicking Choose Code. Apparency defaults to the component itself for Self and Launchd Job types, but it can't figure out what the Parent Process or Responsible Process might be.
Since macOS doesn't provide any public API for evaluating launch constraints, Apparency can only approximate how the macOS kernel will check the constraint. We believe it to be accurate for most “facts,” but there may be subtle differences, since Apparency is determining facts in userspace, without any additional context. In particular, note that
on-authorized-authapfs-volumeis not supported at all (evaluation will fail if this is referenced), andlaunch-typeis always assumed to be zero.Moreover, note that implicit launch constraints sometimes use fact names that are not documented, such as
apple-internal,in-tc-with-constraint-categoryordeveloper-mode. While we can guess what these mean generally, we haven't tried to reverse-engineer how these facts are determined, so Apparency won't support evaluation of such constraints.
Show Bundle Resources
Apps and other bundle-type components typically contain many bundle resources — such as images, nib files or localized strings — which the component loads at runtime.
Because bundle resources influence app behavior (much like its code), they are “sealed” by the component's code signature (again, like its code). If any of these resources are changed, macOS won't be able to verify the code signature, and may refuse to launch the app — typically with an alert about the app being “damaged.” (Exactly how and when this occurs will vary with the version of macOS; Apple has definitely gotten more aggressive about these checks with each passing year.)
Of course, you can see bundle resources in the Finder, e.g. by selecting the component, choosing Show Package Contents from the context menu, and navigating to the Resources folder. But it isn't always obvious which files are protected by the code signature: some folders outside of Resources are still part of the signature, while others — such as Frameworks or PlugIns — contain sub-components that are signed independently (c.f. the discussion of “code places” here).
When macOS reports that an app is “damaged,” it can be awkward to figure out exactly which files are causing the problem. Often, you'll just want to install a fresh copy of the app, but if the problem continues to occur, you might want more details — especially if you're the developer.
In Apparency, a “damaged” component will have a Signed By status of
Bundle resources modified. But whether or not the bundle
resources are valid, you can examine resource details using Apparency's Bundle Resources inspector.
Select a component and choose the Resources toolbar button

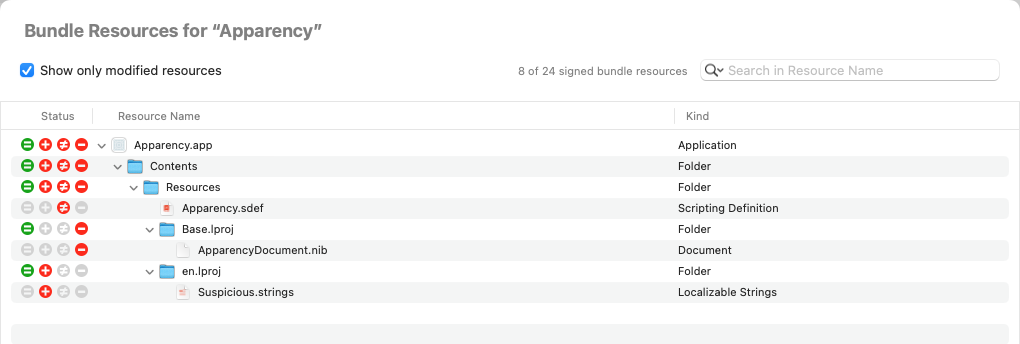
Each resource file will have a single Status icon in the first column, which shows if it has been added, changed or removed: a description of each status icon is available here.
Each resource folder will aggregate the statuses of all files within them, so you can narrow in on any issues.
For a component with Bundle resources modified, Apparency defaults
to showing only the modified resources (as shown in the example above), but you can
uncheck Show only modified resources to see all resources. You can also filter
the list by clicking in the search field (or using Cmd-F) and entering the name (or partial
name) of a resource. Initially, Apparency shows the resources whose Resource Name contains
the entered text, but you can click the search options button


To examine an individual resource file further, Control-click on it and choose Show Resource in Finder or Copy Resource Path. Or you can try to open the resource with Archaeology — which might be able to decode the file, although it is difficult to know without just trying it.
The Bundle Resources inspector shows the resources that are protected by the code signature for the associated component, as recorded by the macOS code signing mechanism. There will usually be other files in the bundle — such as sub-components in official “code places,” or macOS-defined files like Info.plist, provisioning profiles and App Store receipts. All of these are generally bound into the code signature in some way, but are not bundle resources per se, and so won't appear in the Bundle Resources inspector.
Because of the inconsistent handling of “code places” in macOS — as discussed here — you may find that some sub-components also appear in the Bundle Resource inspector for the containing component. For example, if an app contains a legacy Quick Look preview generator under Contents/Library/QuickLook, you'll see every file within that qlgenerator in the Bundle Resources of the containing app. But Apparency will also show the qlgenerator bundle as a sub-component, probably with its own code signature (and even its own Bundle Resources). This is because Contents/Library/QuickLook is not an official “code place” — even though it is the place where Quick Look generators must be installed. Apparency doesn't try to hide this redundancy, because it really does impact the way that code signatures are created and verified at both levels.
It's not uncommon for a bundle to contain no resources at all, in which case the Bundle Resources inspector will show only the bundle itself, with no Status icons: this is fine and normal, as long as no signature verification errors are shown.On the other hand, certain Apple-signed apps really do have resources, but Apple have exempted them from the usual resource signing rules, as discussed further here. This will always be the case for system components, found on the signed system volume (which is already protected and thus doesn't require the resource protections afforded by the code signature). If Apparency reports that ”all bundle resources are excluded from the code signature,” just be aware that there may still be resource files inside the bundle. But this applies only to components that are signed by Apple itself; third party apps are prohibited from modifying the resource signing rules, and any attempt to do so will result in a Can't verify signature status in Apparency.
Show String Literals from an Executable
Occasionally — such as when attempting to reverse engineer a component — you might want to see the fixed strings of text that are almost always embedded in an executable. These are known as string literals, and they can give you clues about what the executable does and how it works, even before you resort to disassembly.
Traditionally, the way to get at the string literals from an executable is to use the strings(1)
command, which on macOS is installed with Xcode or the Developer Command-Line Tools.
Apparency provides a similar — but not identical — mechanism: the Strings Literal inspector.
Simply select a component, and choose Component > Show String Literals from Executable
(Shift-Option-Cmd-X). Apparency will extract the string literals from the executable, and shows them in a list with 3 columns:
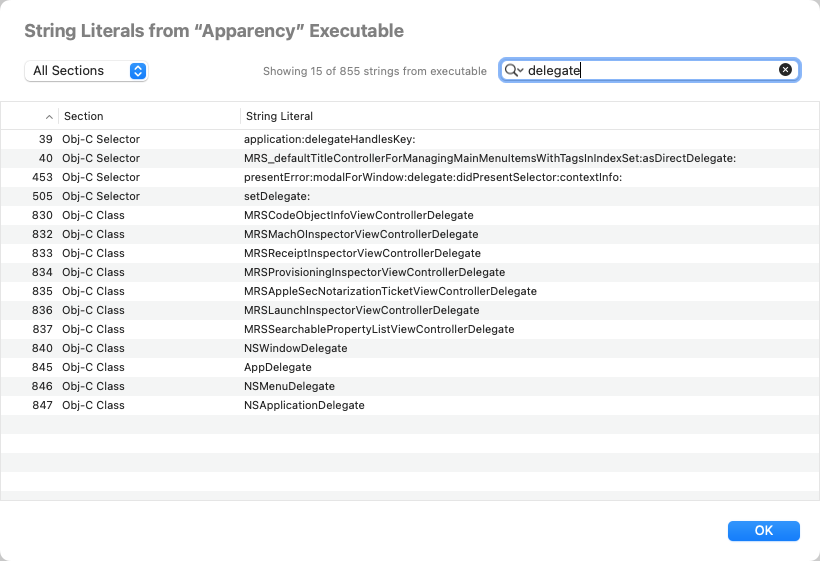
- The numeric index of the string corresponds to the order in which it was defined in the executable. This order is not meaningful most of the time, but sometimes it can be illuminating to see the strings that are defined together. For example, if you search for the name of a command-line option, you might find adjacent strings that correspond to other (possibly undocumented) options. Initially, Apparency shows the strings ordered by this index.
- The Section of the string indicates where in the executable the string was found,
which might give some context about what the string represents. For example, the Log Message section
contains messages sent to the Unified Log subsystem (which will appear in the Console app), and
the Obj-C Class section names classes defined by the code. That said, many strings go into the
C String section, which essentially just means “a quoted string found in the code.”
Apparency searches for strings only in these specific sections of the
__TEXTsegment, which are marked as containing C string literals (that is, having theS_CSTRING_LITERALStype): C String is the__TEXT,__cstringsection, Log Message is__TEXT,__oslogstring, Obj-C Class is__TEXT,__objc_classname, and Obj-C Selector is__TEXT,__objc_methname. There are other string literal sections, like__TEXT,__objc_methtype, but we find these of little use for analysis, so they are not included by default.You can change which
__TEXTsections Apparency will search by going to Apparency > Preferences > Locations > Look for string literals in sections. You can add sections to this list, but note that only sections in the__TEXTsegment will be searched, and then only if those sections have theS_CSTRING_LITERALStype. - The String Literal is the string itself, very slightly cleaned up to escape embedded line breaks and remove invisible control characters. It can be useful to sort on this column to group related strings.
Apparency allows you to narrow down the strings list in a couple of ways. You can change the
All Sections pop-up to show only strings from the selected section.
Or you can search the strings for something specific — such as part of a Console log message, or
a key from running the defaults(1) command. By default, Apparency shows all strings that
contain the entered text, but you can click the search options button


Apparency is much less aggressive thanstrings(1)about finding strings. As noted above, it restricts itself to very specific sections, which are declared to contain (NULL-terminated) C-style strings, and even then considers only a subset of those sections.strings(1)searches every section of every segment (except__TEXT,__text, where executable code lives, unless you use the-aoption).strings(1)also finds anything that “looks like” a string — that is, four or more “printable” characters, whether in NULL-terminated format or not. This obviously finds many more strings, at the cost of giving you more data to plow through.
You can use Show String Literals from Executable on any component that
has an executable — even if it is a system framework or dylib that has been
moved into the DYLD shared cache, and therefore has no standalone
file on disk. This is something that you can't really do with strings(1).
Show Localizable Strings from Bundle Resources
In most macOS apps, the text that you see in the UI is stored as localizable strings within the bundle resource files. The macOS resource mechanisms allow such strings to be localized into different languages — although they may not actually be localized, which is why we call them localizable here.
In any case, it can sometimes be useful to see the localizable strings associated with a component,
especially if you are trying to track where a particular bit of UI is implemented. For this purpose,
Apparency provides a Localizable Strings inspector. Select a component and
choose Component > Show Localizable Strings from Bundle (Cmd-Shift-Option-L):
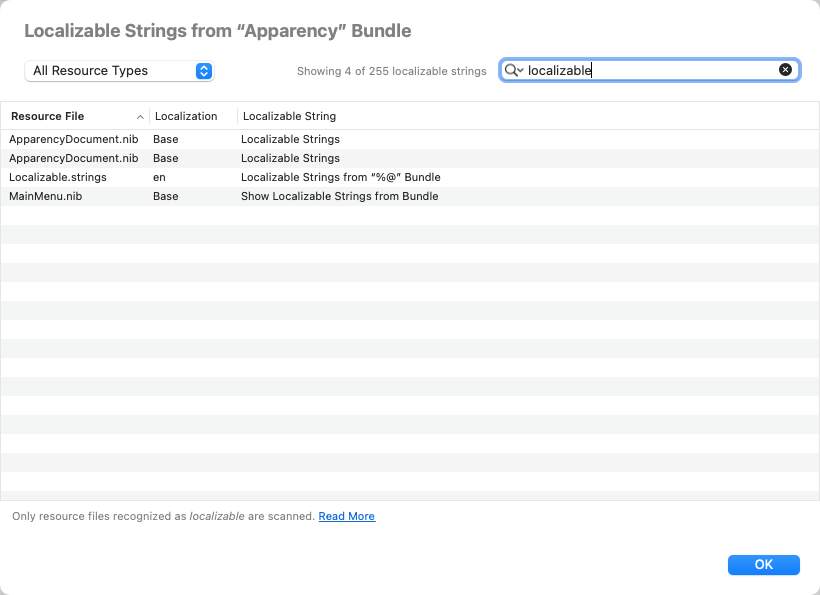
In addition to the Localizable String itself, Apparency also shows the Resource File it came from (such as a nib or strings file), and the specific language (Localization) of that file.
Apparency allows you to narrow down the localizable strings list in a couple of ways. You can change the
All Resource Types pop-up to show only strings from resource files of specific types.
Or you can search the strings for something specific — such as something you see in the app's UI.
By default, Apparency shows the localized strings that contain the entered text, but you can click the
search options button


Apparency might not show every string that appears in the UI, since it has its own concept of what constitutes localizable. This differs by the type of resource file involved, as follows:
- From strings files, Apparency extracts only the values. These are the actual strings shown in the UI (for the user's current language preferences). We don't extract the keys, which can vary in their semantics — sometimes they are distinct symbols assigned by the developer, and other times they are identical to the (usually) English strings.
- In stringsdict files, a given string (by key) will usually reference multiple variations of the displayed string (which is the point of the stringsdict mechanism). A specific string is usually chosen based on a numeric quantity (these are called “plural rules”), although there are also width- and device-specific variations used on iOS. Apparency attempts to extract all of the possible strings that could result, which can be on the redundant side, but improves the odds that searching for a string seen in the UI will result in a match.
- From nib files in the Base.lproj directory, Apparency extracts only recognizably localizable strings. When a Base xib file is compiled, the user interface strings (those that are displayed, such as a label's
stringValueor a button'stitle) are instantiated using theNSLocalizableStringclass: this (private)NSStringsubclass knows how to adjust the string at runtime, using the companion strings and/or stringsdict files (in the active lproj directory). Other strings in the nib — which store identifiers and many other things — still useNSStrings (or other subclasses, like__NSCFString). Anyway, by virtue of this distinctNSLocalizableStringsubclass, Apparency recognizes that the string is something displayable and localizable, and avoids extracting the many other strings in the nib.Contrast this to older style compiled nibs, which get replicated and modified for every language, and which go into the various lproj directories. In these nibs,
NSLocalizableStringisn't used (since the string should already be correct for the containing lproj). As a result, displayable strings and other kinds (like identifiers) are indistinguishable to Apparency (which doesn't understand the complex Interface Builder-generated object graph). As a result, Apparency doesn't try to extract any strings from such nib files.For some macOS deployment targets, ibtool creates nib directories, with multiple nib files in different formats: here Apparency extracts strings from only the newest format nib file.
- Any storyboardc directories usually contain multiple nib files, which are constructed much like the Base.lproj nib files described above (at least in localizable string terms). Apparency will extract
NSLocalizableStrings from all of the nib files in the storyboard directory.- Finally, loctable files are a format used only on the system volume (to our knowledge). It essentially collapses all of the lproj versions of a named strings file together, along with any corresponding stringsdict files. For example, instead of en.lproj/Localizable.strings, en.lproj/Localizable.stringsdict, fr.lproj/Localizable.strings and so on, there will be a single Localizable.loctable in the top-level Resources directory. (This is presumably a disk space optimization for the system volume.) Apparency handles these by choosing the active localization, and treating the values as for strings or stringsdict, as described above.
Show App Store Receipt
An app installed from the App Store usually has an embedded receipt file. This receipt is signed by Apple, and can be used by the app to verify that it was actually purchased by the current user (or by another user sharing the same computer). The receipt can be inspected to see additional App Store and purchase information.
Click the Receipt toolbar button

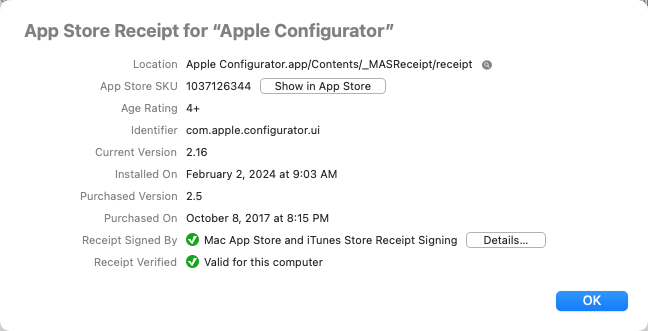
The information shown for an App Store receipt is as follows:
- The Location shows the path to the actual receipt file, relative to the app itself.
Click the adjacent Show in Finder

- The App Store SKU is a product number that identifies the app in the App Store. Click
Show in App Store to open the product page within the App Store app.
As a shortcut, use File > Show in App Store (Cmd-Opt-A) to go directly to the product page, without going through the receipt inspector.
- Identifier shows the bundle identifier for the receipt (which should match the app's bundle identifier).
- The Current Version shows the most recently installed (or updated) version of the app, which was Installed On the given date.
- The Purchased Version shows the version of the app that was in the store at the original time of purchase, as given by the Purchased On date.
- Receipt Signed By shows the certificate that signed the receipt, which should be an Apple certificate associated with the iTunes Store. Click Details to see information about the signing certificate and its trustworthiness.
- Receipt Verified shows the result of Apparency's own verification of the receipt, which is based on Apple's guidelines, but which might not match the verification done by the app itself — if the app actually does any such verification (and it might not). Generally, unless the app was copied from a different computer, or the receipt was copied from a different app, it ought to verify properly. If the receipt does verify, Apparency shows which network interface on your computer was matched. If the receipt can't be verified, you can click the More Info button to get more details.
Show Provisioning Profile
Certain apps — depending on their capabilities and how they're distributed — will have an embedded provisioning profile. This is essentially “permission” from Apple for
- a specified app,
- signed with a specific, Apple-issued developer certificate,
- to use a specified set of Apple services and/or macOS features (“capabilities”),
- and to run on specific Apple devices (or more commonly, on any device).
The provisioning profile must be signed by Apple, which allows Apple to restrict what an app can do and where it can run — even if the app itself is signed by a third-party developer and distributed outside of the App Store.
Generally, the developer creates a provisioning profile through the Apple Developer Program website (or allows Xcode to do so automatically). Some capabilities are allowed routinely — without, one assumes, any human intervention. Other capabilities — such as Endpoint Security extensions or DriverKit drivers — are subject to an Apple approval process. Either way, the app can't use these capabilities without a matching, Apple-signed provisioning profile.
The provisioning profile scheme originated on iOS, where the specification of devices is more meaningful: this is the mechanism by which an iOS app can be installed directly onto a limited number of registered test devices (without going through the App Store). It's possible to use a provisioning profile on macOS to limit an app to running on specific Macs, but this is probably far less common.
Note that not all macOS apps have or require a provisioning profile. If an app doesn't use any of the restricted capabilities, it doesn't need a provisioning profile. Also, an app from the App Store is automatically trusted to use the capabilities found in its entitlements — presumably since these were vetted through App Review before the app was posted on the App Store. Likewise, Apple's own apps — those built into macOS or distributed from the Apple website — don't require provisioning.
macOS enforces the provisioning rules when you open an app: if the app is not from Apple or from the App Store, and if it uses any restricted capabilities, it must have a matching, Apple-signed provisioning profile. If the profile is missing, is invalid or lacks the required capabilities, the app will crash immediately.
With that background, click the Provisioning toolbar button

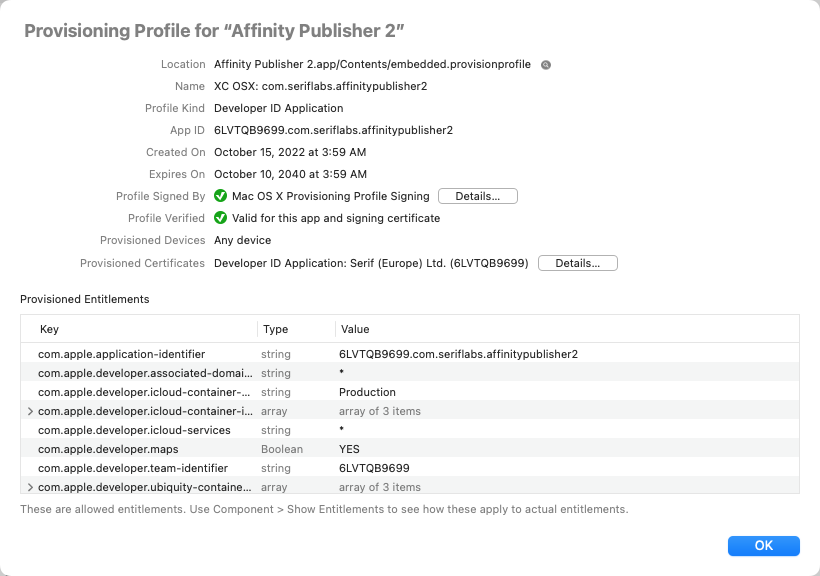
The information shown for a provisioning profile is as follows:
- The Location shows the path to the embedded provisioning profile, relative to the app itself.
Click the adjacent Show in Finder

- The Name is a description assigned by the developer.
- The Profile Kind is typically Developer ID Application, which means that it grants capabilities to an app signed with a Developer ID certificate, for distribution outside of the App Store — the most common case where a provisioning profile is required on macOS. Less common kinds include Ad-hoc (signed with an Apple-issued “distribution” certificate, for limited direct distribution), Development (signed with an Apple-issued “development” certificate, for testing), and App Store (for submitting to App Review).
- The App ID identifies the actual app to which the provisioning profile applies. This usually
contains both the app's bundle identifier and the developer's Apple-issued team ID. Less commonly, for certain
profile kinds, the App ID might use only the team ID with a
*wildcard, allowing the profile to be used with any app from that developer. - Profile Signed By shows the certificate that signed the provisioning profile, which should be an Apple certificate, as discussed above. Click Details to see information about the signing certificate and its trustworthiness.
- Profile Verified shows the result of Apparency's own verification of the provisioning profile, which
ought to be similar to the verification that macOS does when the app is opened. (However, Apple doesn't document
these rules, so this is all based on reverse-engineering.) In general, the profile must be validly signed by
a provisioning-specific Apple signing certificate; the app's bundle identifier and
com.apple.application-identifierentitlement must match the specification in the profile; and the app's signing certificate must be provisioned (as described below). If the profile can't be verified, click the More Info button to see why. - The Provisioned Devices shows if there are specific Macs that are allowed to run this app, although this will almost always be Any device. If specific devices are provisioned, this will be in terms of the device UDID — on a Mac, see Apple > About This Mac > System Report > Hardware > Hardware UUID.
- The Provisioned Certificates are the Apple-issued developer certificates that can be validly used to sign an app that embeds this provisioning profile. Click Details to see information about each certificate. If the profile is verified, one of these certificates will be the same as the one shown by Component > Show Code Signature.
- The Provisioned Entitlements are the capabilities that the app is allowed to use, as granted by this
Apple-signed provisioning profile. This view of the allowed entitlements will often use a
*wildcard to allow arbitrary values for certain capabilities.Use Component > Show Entitlements, described above, to see how the provisioned capabilities apply to the actual app entitlements.
Searching and Filtering the Components
After you've opened a complex app — or perhaps an entire folder — there might be many components shown in the browser. Instead of clicking through them individually, you might want to search instead. You can search for components by name, of course, but also by other several other attributes.
Searching by Component Name
To search for components whose name contains specific text, use Edit > Search Components (Cmd-F).
Enter text in the search field and press Return to do the search:

Apparency will show the matching components, highlighted in yellow. The components that don't match will be hidden, unless they contain one or more matched components: these will still be shown, but without any highlighting.
Using Rules to Filter on Other Attributes
In addition to the name of a component, you can search on other attributes. For example, you can show all components of a particular kind, or those with a specific entitlement.
As above, enter search mode using Edit > Search Components (Cmd-F). Then click the add button


From here, you can add and edit rules, much like in the Finder.
For example, if you choose the kind attribute, you'll get a pop-up menu containing all of the kinds
that are contained inside the top-level component:
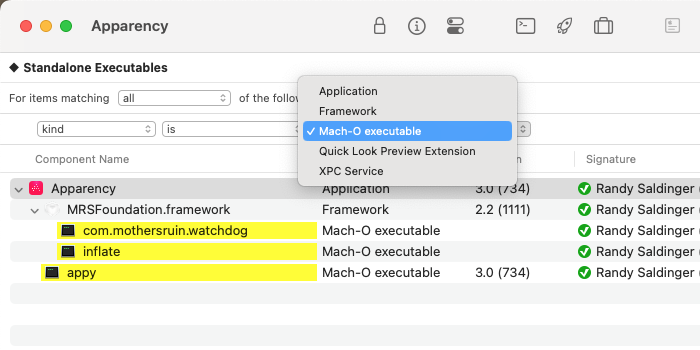
When constructing rule-based searches, the following attributes are available:
- The component name rule is like the simple name-based search described above, but gives more control over how precisely the entered name must match.
- The identifier rule matches components based on their bundle identifiers, or some portion thereof.
- The absolute path rule matches components based on their paths, or more usefully, some portion thereof.
- The kind rule matches components based on their kinds, as illustrated above.
- The uniform type ID rule also matches components based on their kinds, but expressed in
terms of UTI conformance. For example, you can use
uniform type ID
conforms to
com.apple.bundleto match all components that are some kind of bundle. Or use uniform type ID conforms tocom.apple.mach-o-binaryto match all components that are Mach-O executables, dylibs, and so on. This can be more succinct than adding a bunch of any rules for different kinds. - The any Info.plist key and any Info.plist value rules match components based on the contents of their Info.plist files. If the given key (or value) is found at any level in the Info.plist, the component is considered matched. This can be useful for finding components that declare support for specific macOS features, or that vend services of a particular name, for example. You can select matching components and use Component > Show Info Property List (Cmd-Shift-I) to see the keys or values in context.
- The Info.plist key path rule matches components where the
Info.plist file contains a key path having a specific value.
This allows you to match on both key and value, such as
Info.plist key path
CFBundleIdentifierstarts withcom.mothersruin. But you can also do more interesting queries on actual key paths, like Info.plist key pathCFBundleDocumentTypes.CFBundleTypeRolecontainsViewer, to look for theViewervalue in theCFBundleTypeRoleproperty of any of the entries in theCFBundleDocumentTypesarray. For more information and examples on using key paths this way, see this FAQ. - The any entitlement key and any entitlement value rules
match components based on their entitlements. The entitlement keys tend
to be more interesting (these are Apple-defined capabilities) but the values are sometimes more than simple
Boolean values. You can select matching components and use Component > Show Entitlements
(Cmd-Shift-E) to see the keys or values in context.
Because entitlements are stored with the code signature, Apparency can't search them for any component still in Verifying signature status. You can configure rules while Apparency is working, but the immediate results might be incomplete; Apparency will update the results automatically when everything is verified.
- The entitlement key path rule matches components where the
entitlements contain a key path having a specific value.
This is mostly useful for matching both a key and value, such as
entitlement key path
com.apple.security.get-task-allowisYES. If the entitlement is a Boolean type (as many are), you should compare againstYESorNO; for string entitlements, you can use contains or begins with rules instead. Because entitlement names almost always contain period characters, specifying true key paths can be tricky: see this FAQ for details. - The contains code rule matches any component that has a (main) executable, or that is itself a standalone Mach-O executable.
- The executable architecture rule matches components based on which
processor architectures are supported (or not) by their executables. For example,
executable architecture
supports
Apple Silicon — 64-bit , Extended
matches all components where the executable can run on an Apple Silicon Mac (without using
Rosetta). Note that this will include Universal executables with
arm64orarm64eslices, since either can run on Apple Silicon machines. (In practice, only macOS components are allowed to use thearm64etype.)Conversely, you can search for components based on what they do not support. For example, executable architecture doesn't support Intel — 64-bit matches components where the executable can't run on an Intel Mac. (Components that don't have an executable at all are still excluded, since they are presumably beside the point here.)
- The Apple OS platform rule matches components based on their target platform. This is usually macOS, of course, but could also be UIKit for Mac (“Catalyst”) or iOS. For example, you might open a folder and use Apple OS platform is UIKit for Mac (“Catalyst”) to focus on the Catalyst apps therein.
- The required OS version rule matches components based on the
oldest version of macOS it supports. For example,
required OS version
is newer than
13.7matches all components that require something newer than macOS 13.7. If needed, you can specify versions down to the security update (e.g.13.7.4); a value like13is equivalent to13.0.0.For iOS apps installed on Apple Silicon, the required OS version will be an iOS version, not a macOS version. If you use a macOS version for this rule, you might want to add another rule like Apple OS platform is not iOS to avoid getting inappropriate results from iOS apps.
- The any string literal rule matches components based on the
string literals embedded in their executables. If the given text is
found in any string literal, the component is considered matched. You can select matching components and
use Component > Show String Literals from Executable (Cmd-Shift-Option-X) to
see the actual strings.
This rule searches the same
__TEXTsections as the String Literals inspector, and can be controlled via Apparency > Preferences > Locations > Look for string literals in sections. - The any localizable string rule matches components based on the localizable strings contained in their bundles. If the given text is found in any localizable string, the component is considered matched. You can select matching components and use Component > Show Localizable Strings from Bundle (Cmd-Shift-Option-L) to see the actual strings, and where they are defined.
You can add as many rules as needed to narrow in on specific components. Note that, if you hold down the Option key, the add button


Saving Searches
Once you've set up a search — especially a complex one with multiple rules — you might want to save it. Later, you can re-apply the saved search for any component (or folder) you open in Apparency.
To save the current search, click the Save As button on the right side of the search bar:

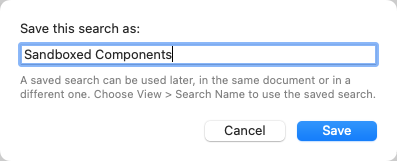
Later, you can re-apply the search by choosing it from the View menu:
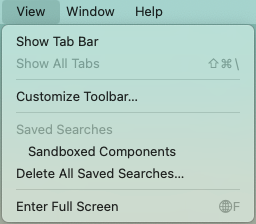
When you re-apply a saved search, the name appears on the left side of the search bar. If you subsequently modify the search rules, the character in front of the search name changes from a filled diamond ◆ to an open one ◇ to indicate that the search has unsaved changes. Click Save As again to update the search (using the same name as before) or save it under a different name; or hold down the Option key and click Save to update the saved search in a single click.
To delete a saved search, hold down the Option key while selecting it from the View menu. If you want to delete all the saved searches, use View > Delete All Saved Searches.
Examining Components in Other Apps
If you want to examine a component beyond what Apparency shows, there are a few ways that Apparency tries to make this easier.
In the Finder
Occasionally, you may want to see a specific component in the Finder; for example, to look at the
individual files that it contains. You can do this easily from Apparency: select the component in
the browser, and click the Reveal toolbar button

In the Terminal
Alternatively, if you want to examine a component in the Terminal, you can select it and choose Edit > Copy Path for Component (Cmd-Shift-C). Then you can paste that path into the Terminal, or wherever.
If you want to show — or copy the path to — the main executable, instead of the component itself, hold down Option while doing the above.
Previewing with Quick Look
Sometimes, a component has a kind that will yield an illuminating Quick Look preview. Select the the component and choose Component > Quick Look Component (Cmd-Y) — or just press the spacebar, as in the Finder.
This is probably mostly useful when the component is actually some sort of script (Bash or Python or what have you), and thus will produce its source text upon previewing. Apps might bundle scripts for various reasons, but note that you might need to enable searching in de facto “code places” in order to see such scripts as components in Apparency (since they tend to live in Resources directories).
If you have any other Quick Look Preview extensions installed, you might get useful previews for other kinds of components. Of course, for most kinds of components — applications, executables and standard bundles like frameworks — the Quick Look preview will be generated by Apparency itself, and isn't going to tell you anything new!
Analyzing an Executable in the Hopper Disassembler
If you're trying to reverse engineer a component, you might want to disassemble its executable. Apparency provides a convenient way to automatically start analysis using the Hopper Disassembler.
Assuming that you already have Hopper installed, select the component in Apparency and choose Component > Analyze Executable Using Hopper Disassembler (Shift-Command-D).
Apparency will use AppleScript to tell Hopper to start the analysis. (The first time you use this command, macOS may ask if you want to allow Apparency to control Hopper; you'll need to allow the access for this to work.) Apparency will tell Hopper to analyze the architecture matching the current system, and to use the default Mach-O analysis options. If the executable was moved into the DYLD shared cache, Apparency will tell Hopper to open the cache, and to select the correct library from that cache.
Either way, Hopper should begin the analysis without any further interaction. Note that Hopper does still display the usual dialogs, but the AppleScript should automate through them. It might appear that Hopper has paused, especially on the DYLD Shared Cache dialog, but give it a couple seconds and it should continue.
If you want to disassemble a different architecture, choose Component > Analyze Executable Using Hopper Disassembler with Architecture, and select the desired architecture. This can be handy where you're better versed in the other instruction set, or where Hopper produces better disassembly or decompilation results for that architecture. This does also work for libraries moved into the DYLD shared cache, thanks to the fact that Hopper can read from any cache that is available on disk.In the typical case where there is exactly one inactive architecture — e.g. you're using an Apple Silicon system, and the executable also supports Intel — you can hold down the Control key and choose Component > Analyze Executable Using Hopper Disassembler with Intel — 64-bit, or simply use the Control-Shift-Command-D shortcut.
If you want to change the analysis options, hold down the Option key and choose Component > Load Executable in Hopper Disassembler instead. Apparency will still pass off the proper executable path — and deal with any DYLD shared cache configuration — but Hopper will stop to let you configure analysis options.
Hopper'sopen executableAppleScript command is pretty powerful, but the documentation is a bit sparse, so we'll mention a couple things we learned when implementing this:First, the “hopperv4” command-line tool also works by sending AppleScript to the app, so you can learn a lot by seeing how it translates arguments into AppleScript. There is a (hidden)
‑‑debug-scriptoption that you can add to have it print that AppleScript. (Yes, we did load Hopper into Hopper; how could we not?)Second, in order to automate the selection of a library from the DYLD shared cache, you need to specify the path to the cache itself as the executable to load, and then specify the
loaderasDYLD_ONE(and notDYLDLoader). Finally, you give it a string that matches the entry in the file table (or at least a unique prefix of that entry). For example:open executable "/System/Cryptexes/OS/System/Library/dyld/dyld_shared_cache_arm64e" with options [{loader name:"DYLD_ONE", selected_string:"libxar.1.dylib"}, {loader name:"Mach-O"}]Apparency actually formats the exact string that Hopper would show for the library, since there are some places where the macOS and iOS (Catalyst) worlds use the same framework names.
Finding App Containers
If an app uses the App Sandbox, it is not allowed to read or write arbitrary files within your home folder — it gets permission only for files that you pick through an Open or Save dialog, or to files or folders declared in its entitlements. Otherwise, it is expected to work totally within its app container.
For each sandboxed app (or other sandboxed component), macOS creates an app container under your Library > Containers folder. The container folder is named after the app's bundle identifier, and within its Data subfolder, contains a structure much like a normal home folder — macOS actually tells the app that this is your home folder.
What actually winds up in this container depends on the app. Preference settings almost always wind up here (instead of in the normal Library > Preferences folder). A “document-based” app — that is, an app which offers File > Open and File > Save, such as Pages or Keynote — will still put files where you tell it (not inside the app container). But a so-called “shoebox” app — one that handles content more abstractly than at the file level, like Photos or Notes — may use the app container more substantively (although often the canonical content might be stored in iCloud).
Anyway, most of the time you can ignore the app container, but especially when debugging an issue, it can
be helpful to inspect it. Apparency tries to make this a bit easier by helping you find the app container:
select the app or other component, and click the Container toolbar button

Alternatively, if you want to examine the container in the Terminal, you can select the component and choose Edit > Copy Path for App Container (Cmd-Shift-K).
Note that individual components other than the top-level app might also have their own app containers. For example, the app might contain a Share Extension or a Quick Look Preview Extension, and these are required to be sandboxed also. Any such sandboxed component will have a separate app container.
Because Apparency itself is sandboxed, it can't access other app's containers — or indeed, anything outside of its own app container. As such, it doesn't really know if the selected component's app container exists, only that the component is sandboxed and where the app container would be. It asks the Finder to show where the app container would be, but it is possible there will be nothing there, since macOS doesn't create the app container until the component is first used.
Finding Shared App Group Containers
Because different sandboxed apps have different app containers, two apps — even two apps in a suite from the same developer — can't share data in their respective app containers. Indeed, even an app and another component within that same app — such as a Share Extension — can't share data in the app container.
Apple's answer to this problem is the app group container. This is a secondary container that
can be accessed by two or more components, as long as they are from the same developer. The
developer defines a group container identifier through the Apple Developer Program website (or through Xcode),
and allows individual apps or components to use that group container via the com.apple.security.application-groups
entitlement. A single group container can be shared amongst any number of components, and a component can have
access to any number of group containers: this is all up to the developer to decide.
macOS creates group containers under your Library > Group Containers folder. Each group container folder
is typically named with the developer's Apple-issued team ID, following by the developer-chosen group identifier.
(Apple apps tend not to follow this pattern, using a group. prefix, or none at all.) Unlike the
app container, the structure of the group container is not standardized, so the developer can organize it in whatever
way they choose. (However, if the group container is used to share preferences, you will likely find a
Library > Preferences folder inside.)
As with the app container, you can use Apparency to find a group container. Select the app or other component, and use Component > Show Group Container X in Finder. (The choices in the Component menu will depend on the selected component and what groups it has access to; if you don't see any Show Group Container items, there are no groups for that component.) Alternatively, to examine the group container in the Terminal, use Edit > Copy Path for Group Container X.
Using From Quick Look
Apparency provides a Quick Look Preview extension, which adds a bit more information to the standard macOS preview for apps.
The Apparency preview works in any normal Quick Look context. For example, if you open a Finder window to
your Applications folder and choose View > as Gallery or View > Show Preview,
you'll get an enhanced preview for the selected app:
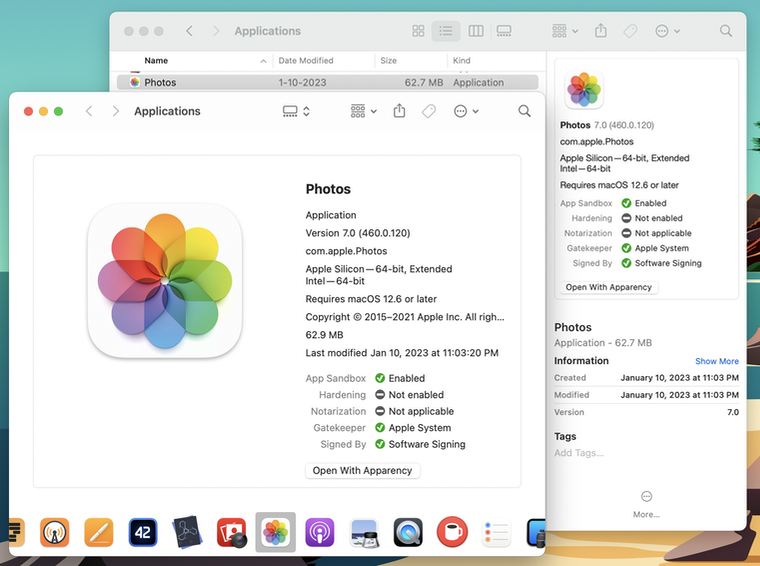
Apparency tries to fit the preview into the space available for it — although macOS makes us guess about this, so you may need to resize the preview pane to see some information.
Note that the information in the Quick Look preview is only for the top-level app that you select; it doesn't consider any components within it. Click the Open With Apparency button to quickly open the app in Apparency, where you can see all the details.
Showing Component Information in the Terminal
As noted above, Apparency provides a command-line tool — called appy — that can be useful when you're working in the Terminal. In addition to opening components in the Apparency app, you can also use the appy tool to get a plain text summary of a component (and its sub-components) right in the Terminal. For example:
appy --show-components xScope.appwill summarize the components like this:
-----------------------------------------------------------------------------------------------------------------------------------------------------------------------------------------
Component                                     | Kind              | Identifier                              | Version      | Flags* | Signed By                    | Parent-Relative Path
-----------------------------------------------------------------------------------------------------------------------------------------------------------------------------------------
xScope                                        | Application       | com.iconfactory.xScope                  | 4.7.1 (141)  | SHNG   | The Iconfactory (RYQWBTQRPT) |
  Sparkle.framework                           | Framework         | org.sparkle-project.Sparkle             | 1.18.1 (1.1… |  HNG   | The Iconfactory (RYQWBTQRPT) | Contents/Frameworks
  YAML.framework                              | Framework         | com.iconfactory.YAML                    | 1.0 (1)      |  HNG   | The Iconfactory (RYQWBTQRPT) | Contents/Frameworks
  org.sparkle-project.InstallerConnection.xpc | XPC Service       | org.sparkle-project.InstallerConnection | 1.18.1 (1.1… |  HNG   | The Iconfactory (RYQWBTQRPT) | Contents/XPCServices
  org.sparkle-project.InstallerLauncher.xpc   | XPC Service       | org.sparkle-project.InstallerLauncher   | 1.18.1 (1.1… |  HNG   | The Iconfactory (RYQWBTQRPT) | Contents/XPCServices
    Updater                                   | Application       | org.sparkle-project.Sparkle.Updater     | 1.18.1 (1.1… |  HNG   | The Iconfactory (RYQWBTQRPT) |   Contents/MacOS
    Autoupdate                                | Mach-O executable |                                         |              |  HNG   | The Iconfactory (RYQWBTQRPT) |   Contents/MacOS
  org.sparkle-project.InstallerStatus.xpc     | XPC Service       | org.sparkle-project.InstallerStatus     | 1.18.1 (1.1… |  HNG   | The Iconfactory (RYQWBTQRPT) | Contents/XPCServices
-----------------------------------------------------------------------------------------------------------------------------------------------------------------------------------------
 * Flags are: S(andboxed), H(ardened), N(otarized), G(atekeeper approved), C(onflicting signatures)
You can change the default set of columns using the ‑‑add-column option. For
example, there are different styles of paths that you might find more useful, and you can opt to show UTIs in place of
(or in addition to) the component Kind.
By default, appy will truncate lines to fit your Terminal window width (unless you redirect the output), but you can
change this using the ‑‑line-width option. You can also change the output format to use
tab-delimited columns, such as for pasting into a spreadsheet, with the ‑‑tab-delimited option.
The‑‑show-componentsoption also works with a folder, but you must add the‑‑folderoption to confirm that you really want to process the entire folder contents. You might want to add‑‑no-sub-componentsto speed things up, if you're only interested in the first level of components in the folder.
Run appy with no arguments to get more information about the various options (and their short equivalents), as well as a full list of the available column names.